![]()
Generate forcing in eWaterCycle with ESMValTool
This notebooks shows how to generate forcing data using ERA5 data and ESMValTool hydrological recipes. More information about data, configuration and installation instructions can be found in the System setup in the eWaterCycle documentation.
1 In:
import logging
import warnings

warnings.filterwarnings("ignore", category=UserWarning)

logger = logging.getLogger("esmvalcore")
logger.setLevel(logging.WARNING)
2 In:
import xarray as xr

import ewatercycle.forcing
Wflow
Generate forcing
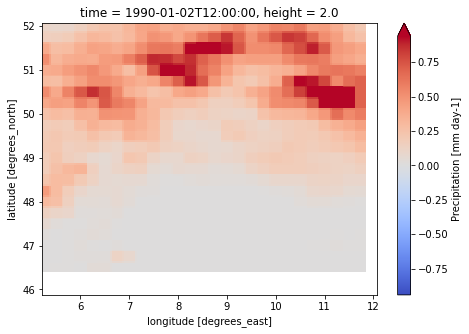
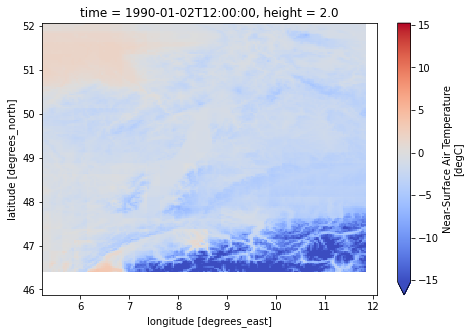
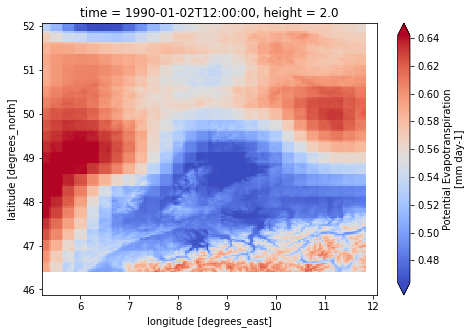
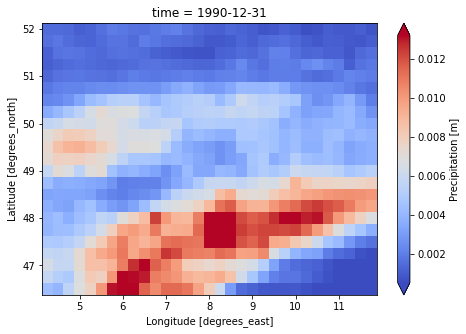
Forcing for Wflow is created using the ESMValTool recipe. It produces one file that contains three variables: temperature, precipitation, and potential evapotranspiration. You can set the start and end date, and the region. See eWaterCycle documentation for more information.
To download wflow_dem.map, see the instructions.
3 In:
wflow_forcing = ewatercycle.forcing.generate(
    target_model="wflow",
    dataset="ERA5",
    start_time="1990-01-01T00:00:00Z",
    end_time="1990-12-31T00:00:00Z",
    shape="./data/Rhine/Rhine.shp",
    model_specific_options={
        "dem_file": "./wflow_rhine_sbm_nc/staticmaps/wflow_dem.map",
    },
)
{'auxiliary_data_dir': PosixPath('/home/sarah/GitHub/ewatercycle/docs/examples'),
 'compress_netcdf': False,
 'config_developer_file': None,
 'config_file': PosixPath('/home/sarah/.esmvaltool/config-user.yml'),
 'drs': {'CMIP5': 'default', 'CMIP6': 'default'},
 'exit_on_warning': False,
 'log_level': 'debug',
 'max_parallel_tasks': 1,
 'output_dir': PosixPath('/home/sarah/temp/output'),
 'output_file_type': 'png',
 'plot_dir': PosixPath('/home/sarah/temp/output/recipe_wflow_20210713_095838/plots'),
 'preproc_dir': PosixPath('/home/sarah/temp/output/recipe_wflow_20210713_095838/preproc'),
 'profile_diagnostic': False,
 'remove_preproc_dir': True,
 'rootpath': {'OBS6': [PosixPath('/home/sarah/temp/ForRecipe')]},
 'run_dir': PosixPath('/home/sarah/temp/output/recipe_wflow_20210713_095838/run'),
 'save_intermediary_cubes': False,
 'work_dir': PosixPath('/home/sarah/temp/output/recipe_wflow_20210713_095838/work'),
 'write_netcdf': True,
 'write_plots': True}
7 In:
print(wflow_forcing)
Forcing data for Wflow
----------------------
Directory: /home/sarah/temp/output/recipe_wflow_20210713_095838/work/wflow_daily/script
Start time: 1990-01-01T00:00:00Z
End time: 1990-12-31T00:00:00Z
Shapefile: None
Additional information for model config:
  - netcdfinput: wflow_ERA5_Rhine_1990_1990.nc
  - Precipitation: /pr
  - Temperature: /tas
  - EvapoTranspiration: /pet
  - Inflow: None
Plot forcing
8 In:
dataset = xr.load_dataset(f"{wflow_forcing.directory}/{wflow_forcing.netcdfinput}")
print(dataset)
for var in ["pr", "tas", "pet"]:
    dataset[var].isel(time=1).plot(cmap="coolwarm", robust=True, size=5)
<xarray.Dataset>
Dimensions:    (bnds: 2, lat: 169, lon: 187, time: 365)
Coordinates:
  * time       (time) datetime64[ns] 1990-01-01T12:00:00 ... 1990-12-31T12:00:00
  * lat        (lat) float64 52.05 52.02 51.98 51.94 ... 46.0 45.97 45.93 45.89
  * lon        (lon) float64 5.227 5.264 5.3 5.337 ... 11.94 11.97 12.01 12.05
    height     float64 2.0
Dimensions without coordinates: bnds
Data variables:
    pr         (time, lat, lon) float32 0.2794 0.2794 0.2794 ... nan nan nan
    time_bnds  (time, bnds) datetime64[ns] 1990-01-01 1990-01-02 ... 1991-01-01
    lat_bnds   (lat, bnds) float64 52.07 52.04 52.04 52.0 ... 45.91 45.91 45.88
    lon_bnds   (lon, bnds) float64 5.209 5.245 5.245 5.282 ... 12.03 12.03 12.07
    tas        (time, lat, lon) float32 0.09246 0.07101 0.03317 ... nan nan nan
    pet        (time, lat, lon) float32 0.5102 0.5103 0.5106 ... nan nan nan
Attributes:
    Conventions:  CF-1.7
    provenance:   <?xml version='1.0' encoding='ASCII'?>\n<prov:document xmln...
    software:     Created with ESMValTool v2.2.0
    caption:      Forcings for the wflow hydrological model.
PCRGlobWB
Generate forcing
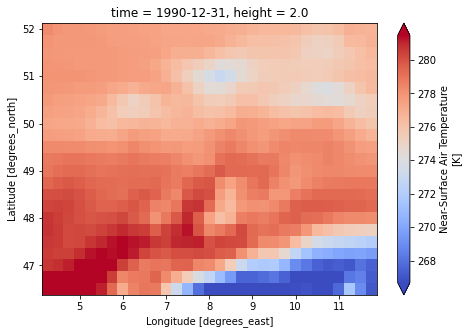
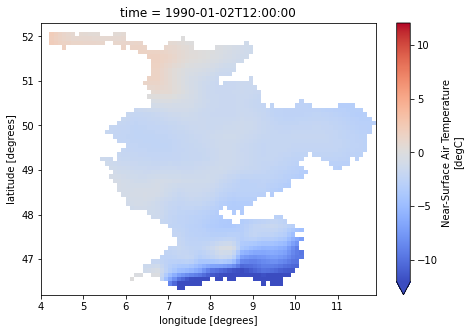
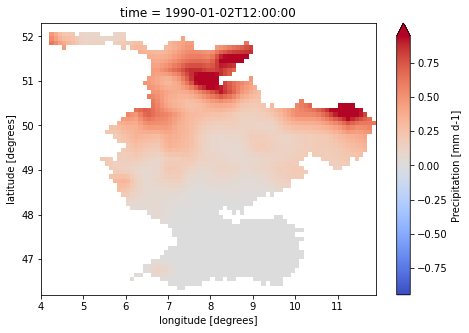
Forcing for PCRGlobWB is created using the ESMValTool recipe. It produces one file per each variable: temperature, and precipitation. You can set the start and end date, and the region. See eWaterCycle documentation for more information.
3 In:
pcrglobwb_forcing = ewatercycle.forcing.generate(
    target_model="pcrglobwb",
    dataset="ERA5",
    start_time="1990-01-01T00:00:00Z",
    end_time="1990-12-31T00:00:00Z",
    shape="./data/Rhine/Rhine.shp",
    model_specific_options={
        "start_time_climatology": "1990-01-01T00:00:00Z",
        "end_time_climatology": "1990-01-01T00:00:00Z",
    },
)
{'auxiliary_data_dir': PosixPath('/home/sarah/GitHub/ewatercycle/docs/examples'),
 'compress_netcdf': False,
 'config_developer_file': None,
 'config_file': PosixPath('/home/sarah/.esmvaltool/config-user.yml'),
 'drs': {'CMIP5': 'default', 'CMIP6': 'default'},
 'exit_on_warning': False,
 'log_level': 'debug',
 'max_parallel_tasks': 1,
 'output_dir': PosixPath('/home/sarah/temp/output'),
 'output_file_type': 'png',
 'plot_dir': PosixPath('/home/sarah/temp/output/recipe_pcrglobwb_20210714_152509/plots'),
 'preproc_dir': PosixPath('/home/sarah/temp/output/recipe_pcrglobwb_20210714_152509/preproc'),
 'profile_diagnostic': False,
 'remove_preproc_dir': True,
 'rootpath': {'OBS6': [PosixPath('/home/sarah/temp/ForRecipe')]},
 'run_dir': PosixPath('/home/sarah/temp/output/recipe_pcrglobwb_20210714_152509/run'),
 'save_intermediary_cubes': False,
 'work_dir': PosixPath('/home/sarah/temp/output/recipe_pcrglobwb_20210714_152509/work'),
 'write_netcdf': True,
 'write_plots': True}
Shapefile /home/sarah/GitHub/ewatercycle/docs/examples/data/Rhine/Rhine.shp is not in forcing directory /home/sarah/temp/output/recipe_pcrglobwb_20210714_152509/work/diagnostic_daily/script. So, it won't be saved in /home/sarah/temp/output/recipe_pcrglobwb_20210714_152509/work/diagnostic_daily/script/ewatercycle_forcing.yaml.
4 In:
print(pcrglobwb_forcing)
Forcing data for PCRGlobWB
--------------------------
Directory: /home/sarah/temp/output/recipe_pcrglobwb_20210714_152509/work/diagnostic_daily/script
Start time: 1990-01-01T00:00:00Z
End time: 1990-12-31T00:00:00Z
Shapefile: /home/sarah/GitHub/ewatercycle/docs/examples/data/Rhine/Rhine.shp
Additional information for model config:
  - temperatureNC: pcrglobwb_OBS6_ERA5_reanaly_1_day_tas_1990-1990_Rhine.nc
  - precipitationNC: pcrglobwb_OBS6_ERA5_reanaly_1_day_pr_1990-1990_Rhine.nc
Plot forcing
8 In:
for file_name in [pcrglobwb_forcing.temperatureNC, pcrglobwb_forcing.precipitationNC]:
    dataset = xr.load_dataset(f"{pcrglobwb_forcing.directory}/{file_name}")
    print(dataset)
    print("------------------------")
    var = list(dataset.data_vars.keys())[0]
    dataset[var].isel(time=-1).plot(cmap="coolwarm", robust=True, size=5)
<xarray.Dataset>
Dimensions:    (bnds: 2, lat: 23, lon: 31, time: 730)
Coordinates:
  * time       (time) datetime64[ns] 1989-01-01 1989-01-02 ... 1990-12-31
  * lat        (lat) float32 52.0 51.75 51.5 51.25 ... 47.25 47.0 46.75 46.5
  * lon        (lon) float32 4.251 4.501 4.751 5.001 ... 11.0 11.25 11.5 11.75
    height     float64 2.0
Dimensions without coordinates: bnds
Data variables:
    tas        (time, lat, lon) float32 273.6 273.2 273.0 ... 271.6 268.9 267.0
    time_bnds  (time, bnds) datetime64[ns] 1988-12-31T12:00:00 ... 1990-12-31...
    lat_bnds   (lat, bnds) float32 51.88 52.12 51.62 51.88 ... 46.88 46.38 46.62
    lon_bnds   (lon, bnds) float32 4.125 4.375 4.375 4.625 ... 11.62 11.62 11.88
Attributes:
    comment:      Contains modified Copernicus Climate Change Service Informa...
    Conventions:  CF-1.7
    provenance:   <?xml version='1.0' encoding='ASCII'?>\n<prov:document xmln...
    software:     Created with ESMValTool v2.2.0
    caption:      Forcings for the PCR-GLOBWB hydrological model.
------------------------
<xarray.Dataset>
Dimensions:    (bnds: 2, lat: 23, lon: 31, time: 730)
Coordinates:
  * time       (time) datetime64[ns] 1989-01-01 1989-01-02 ... 1990-12-31
  * lat        (lat) float32 52.0 51.75 51.5 51.25 ... 47.25 47.0 46.75 46.5
  * lon        (lon) float32 4.251 4.501 4.751 5.001 ... 11.0 11.25 11.5 11.75
Dimensions without coordinates: bnds
Data variables:
    pr         (time, lat, lon) float32 9.197e-06 2.069e-05 ... 0.0002843
    time_bnds  (time, bnds) datetime64[ns] 1988-12-31T12:00:00 ... 1990-12-31...
    lat_bnds   (lat, bnds) float32 51.88 52.12 51.62 51.88 ... 46.88 46.38 46.62
    lon_bnds   (lon, bnds) float32 4.125 4.375 4.375 4.625 ... 11.62 11.62 11.88
Attributes:
    comment:      Contains modified Copernicus Climate Change Service Informa...
    Conventions:  CF-1.7
    provenance:   <?xml version='1.0' encoding='ASCII'?>\n<prov:document xmln...
    software:     Created with ESMValTool v2.2.0
    caption:      Forcings for the PCR-GLOBWB hydrological model.
------------------------
LISFLOOD
Generate forcing
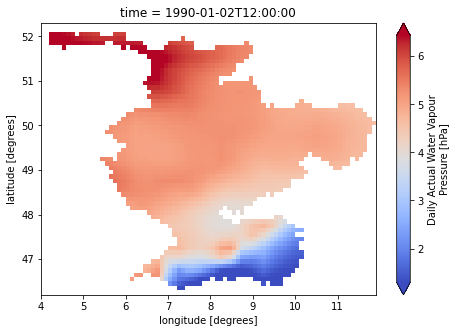
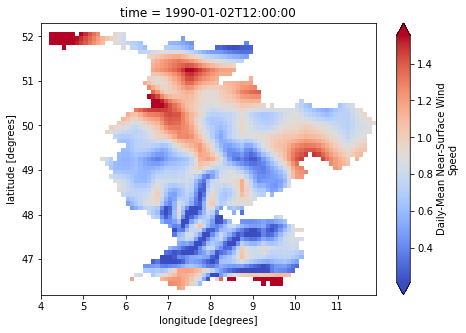
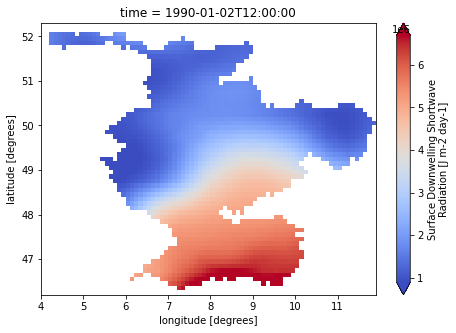
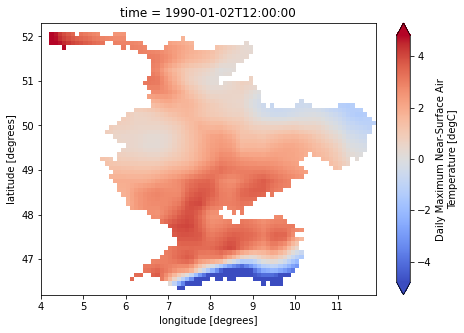
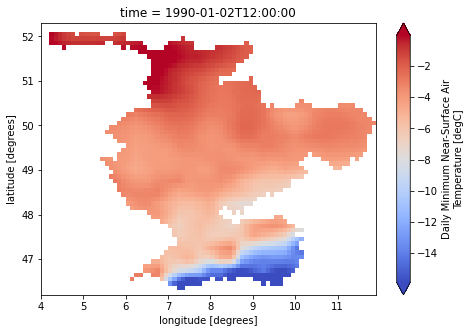
Forcing for LISFLOOD is created using the ESMValTool recipe. It produces one file per each variable: temperature, precipitation, maximum temperature, minimum temperature, u component of wind, v component of wind, surface solar radiation downwards, and dewpoint temperature. Running LISVAP is shown below. For now, LISFLOOD forcing data ‘e0’, ‘es0’ and ‘et0’ are not generated. However, the recipe creates LISVAP input data that can be found in lisflood_forcing.directory. You can set the start
and end date, and the region. See eWaterCycle documentation for more information.
3 In:
lisflood_forcing = ewatercycle.forcing.generate(
    target_model="lisflood",
    dataset="ERA5",
    start_time="1990-01-01T00:00:00Z",
    end_time="1990-12-31T00:00:00Z",
    shape="./data/Rhine/Rhine.shp",
)
WARNING:ewatercycle.forcing._lisflood:target_grid was not given, guestimating from shape
WARNING:ewatercycle.forcing._lisflood:Parameter `run_lisvap` is set to False. No forcing data will be generated for 'e0', 'es0' and 'et0'. However, the recipe creates LISVAP input data that can be found in /home/vagrant/ewatercycle/docs/examples/esmvaltool_output/recipe_lisflood_20220330_104829/work/diagnostic_daily/script.
4 In:
print(lisflood_forcing)
eWaterCycle forcing
-------------------
start_time=1990-01-01T00:00:00Z
end_time=1990-12-31T00:00:00Z
directory=/home/vagrant/ewatercycle/docs/examples/esmvaltool_output/recipe_lisflood_20220330_104829/work/diagnostic_daily/script
shape=/home/vagrant/ewatercycle/docs/examples/data/Rhine/Rhine.shp
PrefixPrecipitation=lisflood_ERA5_Rhine_pr_1990_1990.nc
PrefixTavg=lisflood_ERA5_Rhine_tas_1990_1990.nc
PrefixE0=e0.nc
PrefixES0=es0.nc
PrefixET0=et0.nc
Plot forcing
7 In:
lisvap_input_files = [
    "lisflood_ERA5_Rhine_e_1990_1990.nc",
    "lisflood_ERA5_Rhine_sfcWind_1990_1990.nc",
    "lisflood_ERA5_Rhine_rsds_1990_1990.nc",
    "lisflood_ERA5_Rhine_tasmax_1990_1990.nc",
    "lisflood_ERA5_Rhine_tasmin_1990_1990.nc",
]
for file_name in [
    lisflood_forcing.PrefixTavg,
    lisflood_forcing.PrefixPrecipitation,
] + lisvap_input_files:
    dataset = xr.load_dataset(f"{lisflood_forcing.directory}/{file_name}")
    var = list(dataset.data_vars.keys())[0]
    dataset[var].isel(time=1).plot(cmap="coolwarm", robust=True, size=5)
Generate forcing using LISVAP
Forcing for LISFLOOD is created using the ESMValTool recipe and LISVAP model. ESMValTool recipe produces one file per variable cropped for the catchment: temperature, precipitation, maximum temperature, minimum temperature, u component of wind, v component of wind, surface solar radiation downwards, and dewpoint temperature. Some of these are LISVAP input data. Then, LISVAP generates forcing data ‘e0’, ‘es0’ and ‘et0’, again one file per variable but with global extents. It also generates global datasets from other forcing files and store them in the forcing directory, see the example below.
Running LISVAP needs some model parameters. Currently, ewatercycle supports only a global parameter-set with a resolution of 01 degrees masked by six catchments (the convex hull shapes). The available version of both LISVAP and LISFLOOD only works with this parameter-set. Therefore, we need to prepare some LISVAP-specific data and pass them to ewatercycle.forcing.generate function.
Input arguments of LISVAP:
lisvap_config: This is a configuration file in
xmlformat e.g.settings_lisvap.xml. A template file is avialbel in era5-comparison/lisflood/utils/settings_templates and also under its parameter-set directory.mask_map: a mask for the catchment. This file should have a global extent that matches our global parameter-set. We explain below how to get this file.
version: LISVAP/LISFLOOD model version supported by ewatercycle.
parameterset_dir: the directory of the global parameter-set that can be obtained by
ewatercycle.parameter_sets.get_parameter_set.
Generate convex hull shapefile and mask map:
For our example below, we want to generate a shapefile and a model mask for Doring catchment. The shapefile is passed to ESMValTool recipe whereas the model mask to LISVAP. An auxiliary LISFLOOD file called catchment_masks.nc is available in eWaterCycle/recipes_auxiliary_datasets.
Here we provided a sample code to compute the convex hull of Doring and save it as a shape file. Note that you need to install the package geopandas:
import numpy as np
import xarray as xr
import shapely as shply
from geopandas import GeoSeries

masks = xr.open_dataarray("./data/Lisvap/catchment_masks.nc").load()
buffer = 0.05  # degrees lat/lon
# Compute convex hull
lat, lon = [
    masks[v].values[np.where(masks.loc["Doring"].values)[i]]
    for v, i in zip(["lat", "lon"], [0, 1])
]
hull = GeoSeries(
    [shply.geometry.Point(x, y) for x, y in zip(lon, lat)]
).unary_union.convex_hull.buffer(buffer)
# Save it to shapefile
GeoSeries(hull, crs="EPSG:4326").to_file("./data/Lisvap/Doring_convex.shp")
And here we provided a sample code to produce model mask of Doring and save it as a Netcdf file:
import xarray as xr
masks = xr.open_dataarray("./data/Lisvap/catchment_masks.nc").load()
doring = masks.sel(basin="Doring")
doring.to_netcdf("./data/Lisvap/model_mask_doring.nc")
More information is provided by era5-comparison study.
First, we get the global parameter-set of LISFLOOD for ERA5 as an example. parameter_set provides useful information like directory and supported_model_versions:
3 In:
import ewatercycle.parameter_sets
4 In:
parameter_set = ewatercycle.parameter_sets.get_parameter_set(
    "lisflood_global-masked_01degree_ERA5"
)
print(parameter_set)
Parameter set
-------------
name=lisflood_global-masked_01degree_ERA5
directory=/gpfs/work1/0/wtrcycle/parameter-sets/lisflood_global-masked_01degree
config=/gpfs/work1/0/wtrcycle/parameter-sets/lisflood_global-masked_01degree/settings_lisflood_ERA5.xml
doi=N/A
target_model=lisflood
supported_model_versions={'20.10'}
Second, we use ewatercycle.forcing.generate together with model specific options for LISVAP:
5 In:
lisflood_forcing = ewatercycle.forcing.generate(
    target_model="lisflood",
    dataset="ERA5",
    start_time="1990-01-01T00:00:00Z",
    end_time="1990-12-31T00:00:00Z",
    shape="./data/Lisvap/Doring_convex.shp",
    model_specific_options=dict(
        run_lisvap=dict(
            lisvap_config=f"{parameter_set.directory}/settings_lisvap.xml",
            mask_map="./data/Lisvap/model_mask_doring.nc",
            version="20.10",
            parameterset_dir=parameter_set.directory,
        ),
    ),
)
/gpfs/home2/fakhereh/mambaforge-pypy3/envs/ewatercycle/lib/python3.10/site-packages/xarray/core/indexing.py:1234: PerformanceWarning: Slicing is producing a large chunk. To accept the large
chunk and silence this warning, set the option
    >>> with dask.config.set(**{'array.slicing.split_large_chunks': False}):
    ...     array[indexer]

To avoid creating the large chunks, set the option
    >>> with dask.config.set(**{'array.slicing.split_large_chunks': True}):
    ...     array[indexer]
6 In:
print(lisflood_forcing)
eWaterCycle forcing
-------------------
start_time=1990-01-01T00:00:00Z
end_time=1990-12-31T00:00:00Z
directory=/gpfs/scratch1/shared/ewatercycle/recipe_lisflood_20220218_100026/work/diagnostic_daily/script/global
shape=/gpfs/home2/fakhereh/GitHub/ewatercycle/docs/examples/data/Lisvap/Doring_convex.shp
PrefixPrecipitation=lisflood_ERA5_Doring_convex_pr_1990_1990.nc
PrefixTavg=lisflood_ERA5_Doring_convex_tas_1990_1990.nc
PrefixE0=lisflood_ERA5_Doring_convex_e0_1990_1990.nc
PrefixES0=lisflood_ERA5_Doring_convex_es0_1990_1990.nc
PrefixET0=lisflood_ERA5_Doring_convex_et0_1990_1990.nc
Plot forcing
In:
forcing_files = [
    lisflood_forcing.PrefixPrecipitation,
    lisflood_forcing.PrefixTavg,
    lisflood_forcing.PrefixE0,
    lisflood_forcing.PrefixES0,
    lisflood_forcing.PrefixET0,
]
# Loading global dataset takes a few minutes
for file_name in forcing_files:
    dataset = xr.load_dataset(f"{lisflood_forcing.directory}/{file_name}")
    var = list(dataset.data_vars.keys())[0]
    dataset[var].isel(time=1).sel(lon=slice(18, 22), lat=slice(-31, -34)).plot(
        cmap="coolwarm", robust=True, size=5
    )
Hype
Forcing for Hype is created using the ESMValTool recipe. It produces one file per each variable: temperature, and precipitation. You can set the start and end date.
3 In:
hype_forcing = ewatercycle.forcing.generate(
    target_model="hype",
    dataset="ERA5",
    start_time="1990-01-01T00:00:00Z",
    end_time="1990-12-31T00:00:00Z",
    shape="./data/Rhine/Rhine.shp",
)
print(hype_forcing)
WARNING:esmvalcore._recipe:Missing data for fx variable 'areacella' of dataset ERA5
WARNING:esmvalcore._recipe:Missing data for fx variable 'areacello' of dataset ERA5
WARNING:esmvalcore._recipe:Missing data for fx variable 'areacella' of dataset ERA5
WARNING:esmvalcore._recipe:Missing data for fx variable 'areacello' of dataset ERA5
WARNING:esmvalcore._recipe:Missing data for fx variable 'areacella' of dataset ERA5
WARNING:esmvalcore._recipe:Missing data for fx variable 'areacello' of dataset ERA5
WARNING:esmvalcore._recipe:Missing data for fx variable 'areacella' of dataset ERA5
WARNING:esmvalcore._recipe:Missing data for fx variable 'areacello' of dataset ERA5
eWaterCycle forcing
-------------------
start_time=1990-01-01T00:00:00Z
end_time=1990-12-31T00:00:00Z
directory=/home/sarah/temp/esmvaltool_output/recipe_hype_20220607_123122/work/hype/script/ERA5
shape=/home/sarah/GitHub/ewatercycle/docs/examples/data/Rhine/Rhine.shp
Pobs=Pobs.txt
TMAXobs=TMAXobs.txt
TMINobs=TMINobs.txt
Tobs=Tobs.txt
In: