![]()
Generate forcing in eWaterCycle with ESMValTool
This notebooks shows how to generate forcing data using ERA5 data and ESMValTool hydrological recipes. More information about data, configuration and installation instructions can be found in the System setup in the eWaterCycle documentation.
In:
import logging
import warnings

warnings.filterwarnings("ignore", category=UserWarning)

logger = logging.getLogger("esmvalcore")
logger.setLevel(logging.WARNING)
2 In:
import xarray as xr

import ewatercycle.forcing
Wflow
Generate forcing
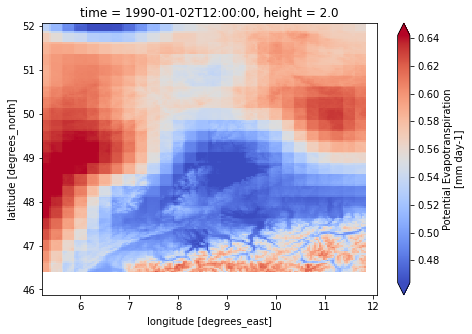
Forcing for Wflow is created using the ESMValTool recipe. It produces one file that contains three variables: temperature, precipitation, and potential evapotranspiration. You can set the start and end date, and the region. See eWaterCycle documentation for more information.
To download wflow_dem.map, see the instructions.
3 In:
wflow_forcing = ewatercycle.forcing.generate(
    target_model="wflow",
    dataset="ERA5",
    start_time="1990-01-01T00:00:00Z",
    end_time="1990-12-31T00:00:00Z",
    shape="./data/Rhine/Rhine.shp",
    model_specific_options={
        "dem_file": "./wflow_rhine_sbm_nc/staticmaps/wflow_dem.map",
    },
)
{'auxiliary_data_dir': PosixPath('/home/sarah/GitHub/ewatercycle/docs/examples'),
 'compress_netcdf': False,
 'config_developer_file': None,
 'config_file': PosixPath('/home/sarah/.esmvaltool/config-user.yml'),
 'drs': {'CMIP5': 'default', 'CMIP6': 'default'},
 'exit_on_warning': False,
 'log_level': 'debug',
 'max_parallel_tasks': 1,
 'output_dir': PosixPath('/home/sarah/temp/output'),
 'output_file_type': 'png',
 'plot_dir': PosixPath('/home/sarah/temp/output/recipe_wflow_20210713_095838/plots'),
 'preproc_dir': PosixPath('/home/sarah/temp/output/recipe_wflow_20210713_095838/preproc'),
 'profile_diagnostic': False,
 'remove_preproc_dir': True,
 'rootpath': {'OBS6': [PosixPath('/home/sarah/temp/ForRecipe')]},
 'run_dir': PosixPath('/home/sarah/temp/output/recipe_wflow_20210713_095838/run'),
 'save_intermediary_cubes': False,
 'work_dir': PosixPath('/home/sarah/temp/output/recipe_wflow_20210713_095838/work'),
 'write_netcdf': True,
 'write_plots': True}
7 In:
print(wflow_forcing)
Forcing data for Wflow
----------------------
Directory: /home/sarah/temp/output/recipe_wflow_20210713_095838/work/wflow_daily/script
Start time: 1990-01-01T00:00:00Z
End time: 1990-12-31T00:00:00Z
Shapefile: None
Additional information for model config:
  - netcdfinput: wflow_ERA5_Rhine_1990_1990.nc
  - Precipitation: /pr
  - Temperature: /tas
  - EvapoTranspiration: /pet
  - Inflow: None
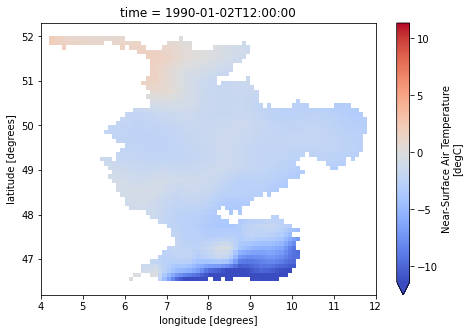
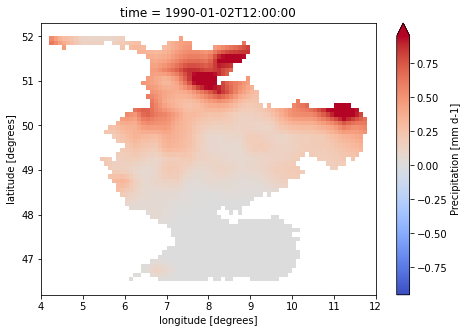
Plot forcing
8 In:
dataset = xr.load_dataset(f"{wflow_forcing.directory}/{wflow_forcing.netcdfinput}")
print(dataset)
for var in ["pr", "tas", "pet"]:
    dataset[var].isel(time=1).plot(cmap="coolwarm", robust=True, size=5)
<xarray.Dataset>
Dimensions:    (bnds: 2, lat: 169, lon: 187, time: 365)
Coordinates:
  * time       (time) datetime64[ns] 1990-01-01T12:00:00 ... 1990-12-31T12:00:00
  * lat        (lat) float64 52.05 52.02 51.98 51.94 ... 46.0 45.97 45.93 45.89
  * lon        (lon) float64 5.227 5.264 5.3 5.337 ... 11.94 11.97 12.01 12.05
    height     float64 2.0
Dimensions without coordinates: bnds
Data variables:
    pr         (time, lat, lon) float32 0.2794 0.2794 0.2794 ... nan nan nan
    time_bnds  (time, bnds) datetime64[ns] 1990-01-01 1990-01-02 ... 1991-01-01
    lat_bnds   (lat, bnds) float64 52.07 52.04 52.04 52.0 ... 45.91 45.91 45.88
    lon_bnds   (lon, bnds) float64 5.209 5.245 5.245 5.282 ... 12.03 12.03 12.07
    tas        (time, lat, lon) float32 0.09246 0.07101 0.03317 ... nan nan nan
    pet        (time, lat, lon) float32 0.5102 0.5103 0.5106 ... nan nan nan
Attributes:
    Conventions:  CF-1.7
    provenance:   <?xml version='1.0' encoding='ASCII'?>\n<prov:document xmln...
    software:     Created with ESMValTool v2.2.0
    caption:      Forcings for the wflow hydrological model.
PCRGlobWB
Generate forcing
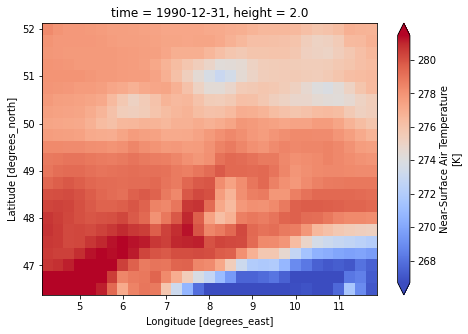
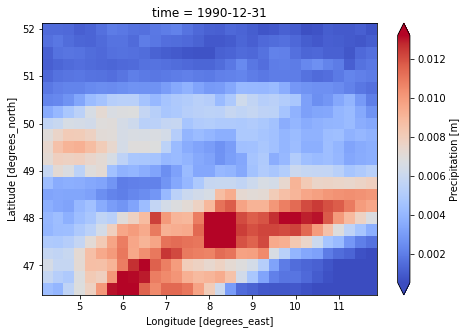
Forcing for PCRGlobWB is created using the ESMValTool recipe. It produces one file per each variable: temperature, and precipitation. You can set the start and end date, and the region. See eWaterCycle documentation for more information.
3 In:
pcrglobwb_forcing = ewatercycle.forcing.generate(
    target_model="pcrglobwb",
    dataset="ERA5",
    start_time="1990-01-01T00:00:00Z",
    end_time="1990-12-31T00:00:00Z",
    shape="./data/Rhine/Rhine.shp",
    model_specific_options={
        "start_time_climatology": "1990-01-01T00:00:00Z",
        "end_time_climatology": "1990-01-01T00:00:00Z",
    },
)
{'auxiliary_data_dir': PosixPath('/home/sarah/GitHub/ewatercycle/docs/examples'),
 'compress_netcdf': False,
 'config_developer_file': None,
 'config_file': PosixPath('/home/sarah/.esmvaltool/config-user.yml'),
 'drs': {'CMIP5': 'default', 'CMIP6': 'default'},
 'exit_on_warning': False,
 'log_level': 'debug',
 'max_parallel_tasks': 1,
 'output_dir': PosixPath('/home/sarah/temp/output'),
 'output_file_type': 'png',
 'plot_dir': PosixPath('/home/sarah/temp/output/recipe_pcrglobwb_20210714_152509/plots'),
 'preproc_dir': PosixPath('/home/sarah/temp/output/recipe_pcrglobwb_20210714_152509/preproc'),
 'profile_diagnostic': False,
 'remove_preproc_dir': True,
 'rootpath': {'OBS6': [PosixPath('/home/sarah/temp/ForRecipe')]},
 'run_dir': PosixPath('/home/sarah/temp/output/recipe_pcrglobwb_20210714_152509/run'),
 'save_intermediary_cubes': False,
 'work_dir': PosixPath('/home/sarah/temp/output/recipe_pcrglobwb_20210714_152509/work'),
 'write_netcdf': True,
 'write_plots': True}
Shapefile /home/sarah/GitHub/ewatercycle/docs/examples/data/Rhine/Rhine.shp is not in forcing directory /home/sarah/temp/output/recipe_pcrglobwb_20210714_152509/work/diagnostic_daily/script. So, it won't be saved in /home/sarah/temp/output/recipe_pcrglobwb_20210714_152509/work/diagnostic_daily/script/ewatercycle_forcing.yaml.
4 In:
print(pcrglobwb_forcing)
Forcing data for PCRGlobWB
--------------------------
Directory: /home/sarah/temp/output/recipe_pcrglobwb_20210714_152509/work/diagnostic_daily/script
Start time: 1990-01-01T00:00:00Z
End time: 1990-12-31T00:00:00Z
Shapefile: /home/sarah/GitHub/ewatercycle/docs/examples/data/Rhine/Rhine.shp
Additional information for model config:
  - temperatureNC: pcrglobwb_OBS6_ERA5_reanaly_1_day_tas_1990-1990_Rhine.nc
  - precipitationNC: pcrglobwb_OBS6_ERA5_reanaly_1_day_pr_1990-1990_Rhine.nc
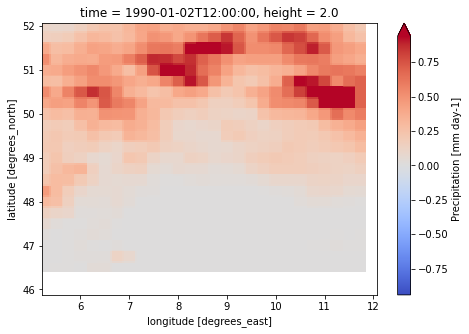
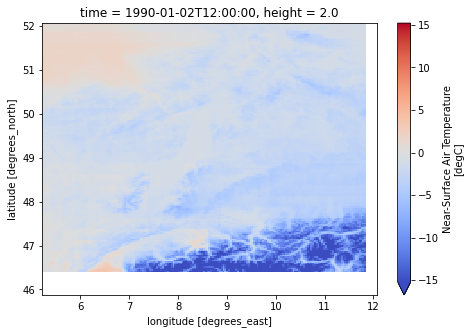
Plot forcing
8 In:
for file_name in [pcrglobwb_forcing.temperatureNC, pcrglobwb_forcing.precipitationNC]:
    dataset = xr.load_dataset(f"{pcrglobwb_forcing.directory}/{file_name}")
    print(dataset)
    print("------------------------")
    var = list(dataset.data_vars.keys())[0]
    dataset[var].isel(time=-1).plot(cmap="coolwarm", robust=True, size=5)
<xarray.Dataset>
Dimensions:    (bnds: 2, lat: 23, lon: 31, time: 730)
Coordinates:
  * time       (time) datetime64[ns] 1989-01-01 1989-01-02 ... 1990-12-31
  * lat        (lat) float32 52.0 51.75 51.5 51.25 ... 47.25 47.0 46.75 46.5
  * lon        (lon) float32 4.251 4.501 4.751 5.001 ... 11.0 11.25 11.5 11.75
    height     float64 2.0
Dimensions without coordinates: bnds
Data variables:
    tas        (time, lat, lon) float32 273.6 273.2 273.0 ... 271.6 268.9 267.0
    time_bnds  (time, bnds) datetime64[ns] 1988-12-31T12:00:00 ... 1990-12-31...
    lat_bnds   (lat, bnds) float32 51.88 52.12 51.62 51.88 ... 46.88 46.38 46.62
    lon_bnds   (lon, bnds) float32 4.125 4.375 4.375 4.625 ... 11.62 11.62 11.88
Attributes:
    comment:      Contains modified Copernicus Climate Change Service Informa...
    Conventions:  CF-1.7
    provenance:   <?xml version='1.0' encoding='ASCII'?>\n<prov:document xmln...
    software:     Created with ESMValTool v2.2.0
    caption:      Forcings for the PCR-GLOBWB hydrological model.
------------------------
<xarray.Dataset>
Dimensions:    (bnds: 2, lat: 23, lon: 31, time: 730)
Coordinates:
  * time       (time) datetime64[ns] 1989-01-01 1989-01-02 ... 1990-12-31
  * lat        (lat) float32 52.0 51.75 51.5 51.25 ... 47.25 47.0 46.75 46.5
  * lon        (lon) float32 4.251 4.501 4.751 5.001 ... 11.0 11.25 11.5 11.75
Dimensions without coordinates: bnds
Data variables:
    pr         (time, lat, lon) float32 9.197e-06 2.069e-05 ... 0.0002843
    time_bnds  (time, bnds) datetime64[ns] 1988-12-31T12:00:00 ... 1990-12-31...
    lat_bnds   (lat, bnds) float32 51.88 52.12 51.62 51.88 ... 46.88 46.38 46.62
    lon_bnds   (lon, bnds) float32 4.125 4.375 4.375 4.625 ... 11.62 11.62 11.88
Attributes:
    comment:      Contains modified Copernicus Climate Change Service Informa...
    Conventions:  CF-1.7
    provenance:   <?xml version='1.0' encoding='ASCII'?>\n<prov:document xmln...
    software:     Created with ESMValTool v2.2.0
    caption:      Forcings for the PCR-GLOBWB hydrological model.
------------------------
LISFLOOD
Generate forcing
Forcing for LISFLOOD is created using the ESMValTool recipe. It produces one file per each variable: temperature, precipitation, maximum temperature, minimum temperature, u component of wind, v component of wind, surface solar radiation downwards, and dewpoint temperature. Running LISVAP is not implemented yet. Therefore, LISFLOOD forcing data ‘e0’, ‘es0’ and ‘et0’ are not generated. However, the recipe creates LISVAP input data that can be found in lisflood_forcing.directory. You can set
the start and end date, and the region. See eWaterCycle documentation for more information.
4 In:
lisflood_forcing = ewatercycle.forcing.generate(
    target_model="lisflood",
    dataset="ERA5",
    start_time="1990-01-01T00:00:00Z",
    end_time="1990-12-31T00:00:00Z",
    shape="./data/Rhine/Rhine.shp",
)
{'auxiliary_data_dir': PosixPath('/home/sarah/GitHub/ewatercycle/docs/examples'),
 'compress_netcdf': False,
 'config_developer_file': None,
 'config_file': PosixPath('/home/sarah/.esmvaltool/config-user.yml'),
 'drs': {'CMIP5': 'default', 'CMIP6': 'default'},
 'exit_on_warning': False,
 'log_level': 'debug',
 'max_parallel_tasks': 1,
 'output_dir': PosixPath('/home/sarah/temp/output'),
 'output_file_type': 'png',
 'plot_dir': PosixPath('/home/sarah/temp/output/recipe_lisflood_20210713_095903/plots'),
 'preproc_dir': PosixPath('/home/sarah/temp/output/recipe_lisflood_20210713_095903/preproc'),
 'profile_diagnostic': False,
 'remove_preproc_dir': True,
 'rootpath': {'OBS6': [PosixPath('/home/sarah/temp/ForRecipe')]},
 'run_dir': PosixPath('/home/sarah/temp/output/recipe_lisflood_20210713_095903/run'),
 'save_intermediary_cubes': False,
 'work_dir': PosixPath('/home/sarah/temp/output/recipe_lisflood_20210713_095903/work'),
 'write_netcdf': True,
 'write_plots': True}
The run_lisvap is False. Therefore, LISFLOOD forcing data 'e0', 'es0' and 'et0' are not generated. However, the recipe creates LISVAP input data that can be found in /home/sarah/temp/output/recipe_lisflood_20210713_095903/work/diagnostic_daily/script.
5 In:
print(lisflood_forcing)
eWaterCycle forcing
-------------------
start_time=1990-01-01T00:00:00Z
end_time=1990-12-31T00:00:00Z
directory=/home/sarah/temp/output/recipe_lisflood_20210713_095903/work/diagnostic_daily/script
shape=None
PrefixPrecipitation=lisflood_ERA5_Rhine_pr_1990_1990.nc
PrefixTavg=lisflood_ERA5_Rhine_tas_1990_1990.nc
PrefixE0=e0.nc
PrefixES0=es0.nc
PrefixET0=et0.nc
Plot forcing
6 In:
for file_name in [lisflood_forcing.PrefixTavg, lisflood_forcing.PrefixPrecipitation]:
    dataset = xr.load_dataset(f"{lisflood_forcing.directory}/{file_name}")
    var = list(dataset.data_vars.keys())[0]
    dataset[var].isel(time=1).plot(cmap="coolwarm", robust=True, size=5)